Dzifa Amexo discusses her data career journey and why you should be reading her Yelp reviews.
Brunch with Dzifa.
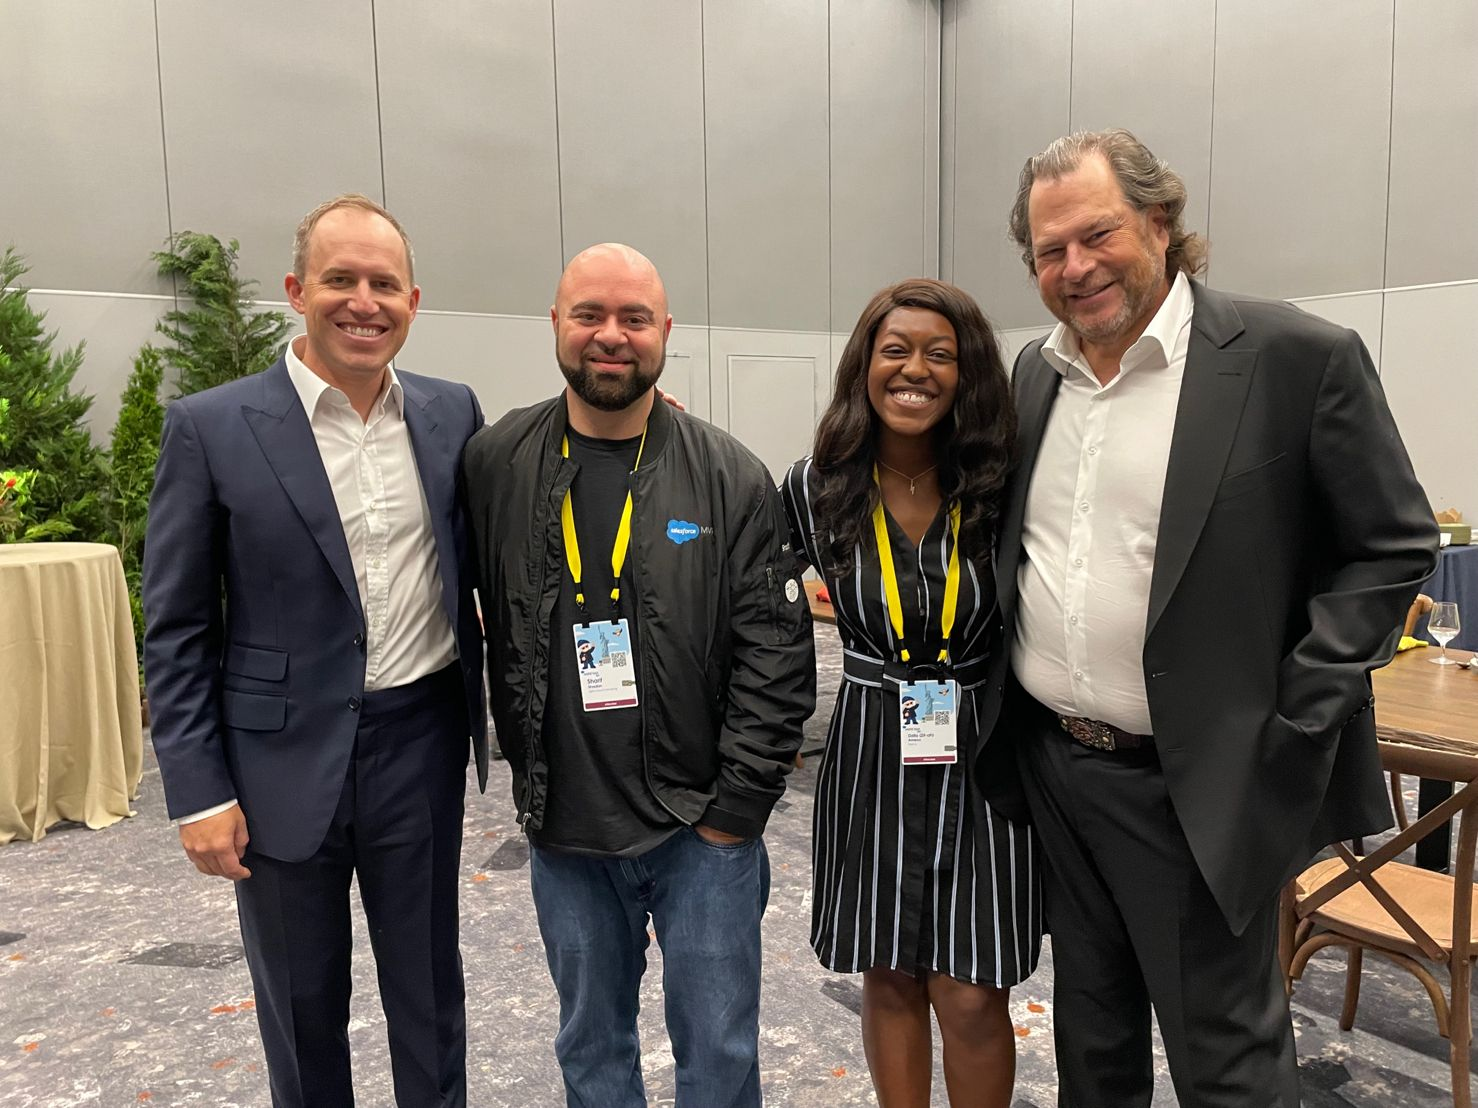
This past labor day weekend Sarah Rodriquez, Dzifa Amexo and myself met up in person for the first time. It was a fun and emotional reunion of sorts. Like most pandemic friendships of late, we all met online. Sarah and I met on a data literacy Slack channel and have been collaborating ever since. We have the social media posts, articles, podcasts and Data Literacy Awards to show for it. In fact, when Sarah and I were planning to meet up, we wanted to do a live interview with someone from the datasphere. This is where Dzifa comes in!
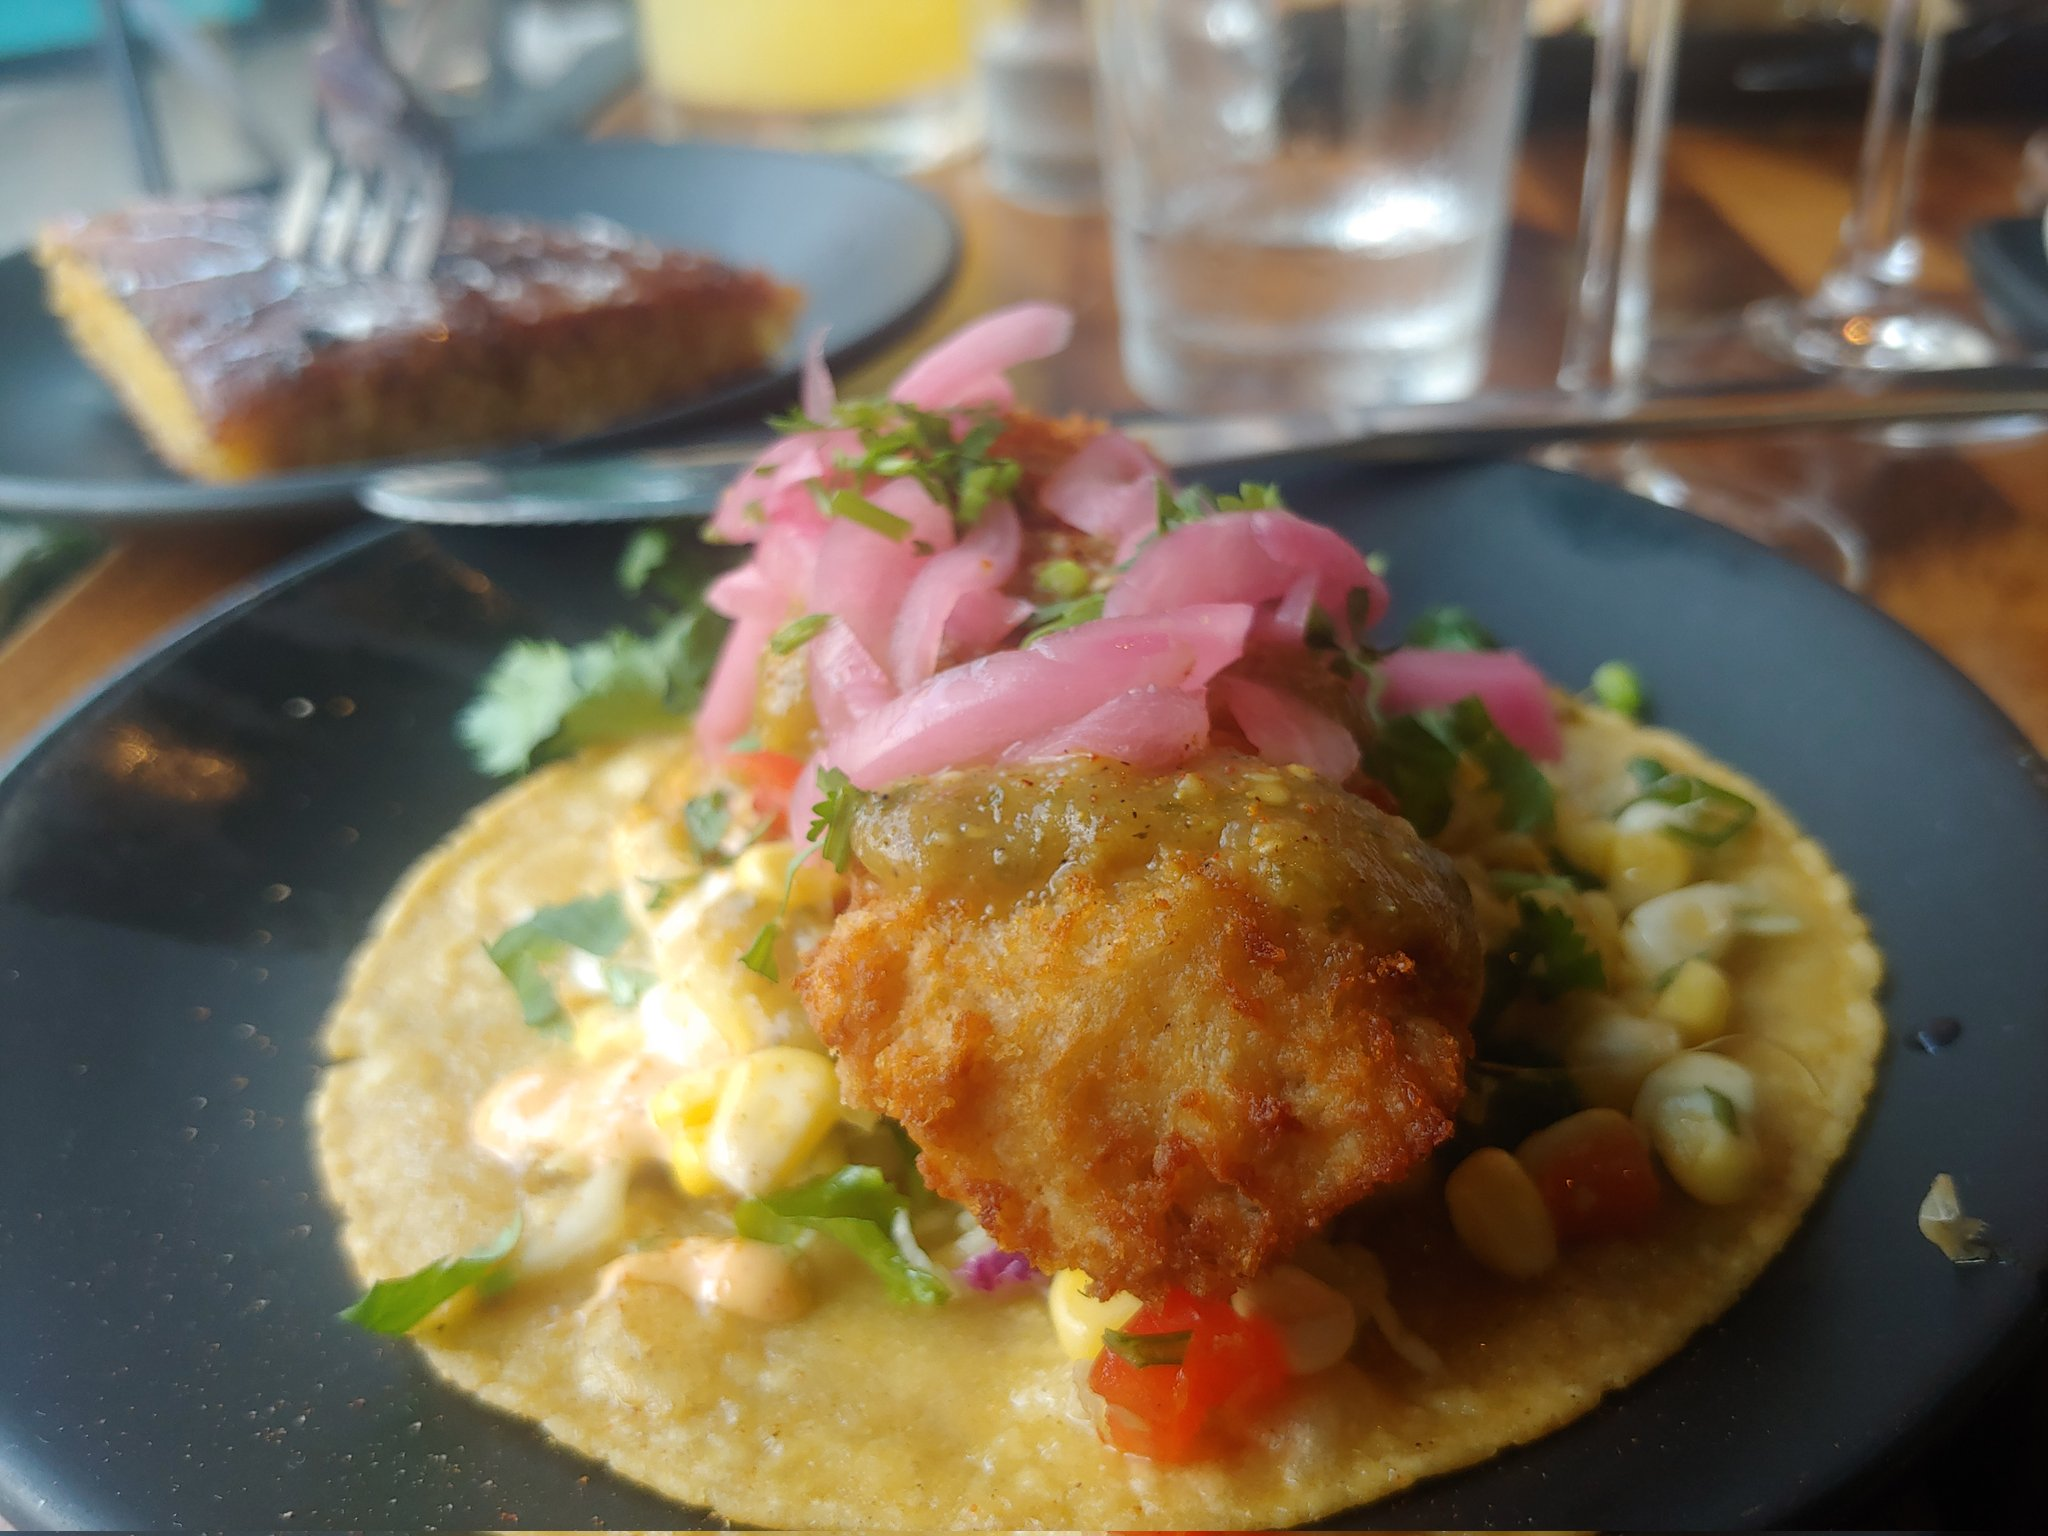
Dzifa is a two-time Tableau Ambassador and foodie extraordinaire. She's been making huge waves in the datasphere and her energy and enthusiasm for data is contagious. Dzifa was happy to meet up with Sarah and I for a chat and we all decided to have brunch at Mexique in the NYC neighborhood of Chelsea.
Sarah Rodriquez: Tell us a little bit about yourself.
Dzifa Amexo: I’m currently a Data Technology Analyst at Keyrus. I was born and raised in a town in Southern New Jersey called Moorestown. This is not to be confused with Morristown which is in North Jersey! I'm now living in NYC so I consider myself a New Yorker in training!
Allen Hillery: Where did you attend college?
DA: I went to college at Mercy College in Dobbs Ferry, NY which I had never heard of before my junior year of high school. I found out about Mercy through my business teacher and ended up attending a summer leadership academy in summer 2016 that fundamentally changed who I am to this day I believe. Going to Mercy was honestly one of the best decisions I made!
AH: What have you been doing for fun in the Big City?
DA: When I’m not on Twitter or Tableau and outside of work I love to brunch (yes it’s a verb), karaoke, read, rollerblade, hang out with friends, and explore new places and foods! As well as spend too much time writing in-depth yelp reviews.
On college life and getting introduced to data.
AH: As a first generation college student in my immediate family and being the oldest sibling, I felt enormous pressure to perform and excel well in college. What was your experience like?
DA: YES. I am the youngest so the pressure was definitely a bit less, shoutout to my older sisters. But nonetheless, education has always been very important to our family. I learned a lot about this actually through my recent trip to Ghana. Hearing stories about how my grandfather was passionate about education and how hard he worked to provide for all his children gave me goosebumps.
The pressure is more-so intrinsic I think for me. Typically, there is a running joke that many African parents would want to see their children become, doctors, lawyers, or engineers. I am so grateful that my parents were very open about what I wanted to pursue. They said that whatever I do they just want me to do it to the best of my ability and be happy!
AH: The older I get, I've come to realize that most parents just want the best for their kids. I can imagine as immigrants starting a life in a new country that your parents made a lot of sacrifices to come to America.
DA: My parents sacrificed SO much to provide me with a life that was not nearly as hard as theirs. I don’t take that for granted and always want to make them proud and feel like their sacrifice was worth it. I went to college with the mindset of I am here to get a job at the end of the day. Work hard, be happy, and be able to give back as much as I can to my parents. Their work ethic is one of the things that I inherited and has taken me very far in life.
SR: When were you first introduced to data in your academic career?
DA: I used to always say high school but now diving a bit deeper I think I was informally introduced to it at a very early age. Back in the day, I distinctly remember counting out the colors of M&M’s or Skittles to make bar graphs. At the time, I was mainly excited to eat the candy but that was my first exposure to data.
Later in my academic career, I was formally introduced during my AP Stats class senior year. I’ll say it a thousand times but the Hans Rosling Ted Talk has lived in my head rent free since that day. Learning about z-scores is not the most exciting thing but my teacher was so passionate that it definitely transferred to us as well. I learned data isn’t boring, we collect and analyze all this data for a reason. It can be used to transform lives, make change. It’s fundamental to our world and its progress.
On choosing a major and realizing that "Data is Everywhere".
SR: You mentioned in college that you first majored in marketing but didn't feel creative enough? Can you elaborate on that?
DA: I laugh about this now but at the time I remember thinking that marketing was only coming up with catchy jingles or ways to advertise but it is so much more than that. Stereotypically, I wasn’t “artistically” inclined, I was always more on the academic side. Math was my jam back in the day!
I think I fell into the trap of thinking you have to be “a certain type of person” and I didn’t fit the mold. I thought either you’re born with creativity and you’re an artist or you’re not creative. But there is room in between and I believe creativity is a fluid term.
Now, I have come to learn that marketing is a very analytical field. Like many fields, it’s multi-faceted, which is the beauty of it. You could find a role that’s heavy on the creative side, or the analytical side, or maybe a mix of both!
AH: Did making the switch from marketing to business become more data intensive for you?
DA: Very much so. Even before I switched to pursue analytics as my second concentration, finance was data intensive on its own. I remember doing a project my freshman year where we had to use Bloomberg terminals to analyze a public company and make a recommendation on where we think their stock will be in the next five years. As you can imagine, there was so much data. We reviewed annual reports, investor calls, stock forecasts, price targets, etc. This project trained us to think like an analyst and make sense of the data. It wasn’t just about calculating the projections, we had to tell a story!
On post college life and career pivots.
SR: Describe your career journey since you've graduated from college?
DA: It’s been a wild ride! Post graduation, I started at Deloitte as a Risk and Financial Advisory Analyst in their Regulatory & Legal division. I met some really wonderful people at Deloitte but ultimately I felt it was time for me to move on after several months. Earlier this year, I joined Keyrus as a Data Technology Analyst (shoutout to Adam Mico & the #datafam) and it’s been an amazing experience so far!
SR: That was brave of you to recognize you needed to pivot! Tell us a little more about your time at Keyrus.
DA: I learn something new everyday and my team is beyond supportive. Before I started at my current role I had no clue what Tableau Server or Tableau Cloud was but now I know what they are and have done a few Server to Cloud Migrations. I am at the beginning of my career and I am so grateful for where I am and everyone that has contributed to my growth and helped me along the way.
AH: What have you learned from this experience?
DA: Careers are a marathon not a sprint! I think as a society, there is a tendency to feel like you have to have your whole life and career figured out. I didn’t know I’d be here five years ago and who knows where I’ll be five years from now. As long as I’m happy, learning, and thriving I’m good!

On exploring a career in data visualization and what the future holds.
AH: Any additional advice for those looking to explore a data visualization career?
DA: I’d say three things. First, you don’t have to come from a traditional path. I recognize that I had a pretty traditional start but there is beauty in all journeys! Don’t discredit your experiences and what you’ve learned along the way. I hope we continue to see more people and stories that show you can come from anywhere and do anything and still pursue a career in data viz. That’s one of the reasons why I love BeDataLit!
Second, get your hands dirty by starting a portfolio! Practice and feedback are the best ways to improve. I learned several topics in school but it wasn’t until I actually practiced it myself that I understood it. I probably had to make a parameter 30 times before I actually understood it and the same goes for white space. When I was learning by myself, I thought my visualizations were actually perfect. After sharing it with others and getting feedback, I was able to understand they were not lol but more importantly, fundamentals in data viz and how to improve. As a bonus, it is also a great way to track your progress and can be leveraged in interviews!
Third, always ask yourself something along the lines of ‘‘what story am I trying to tell’? or ‘what’s the point?’ Early on, I would create my visualizations in a way that was just throwing random bar graphs on a page and calling it data visualization. It’s one thing to build a donut chart but it’s another thing for that to have meaning to your audience. This is definitely a skill that took me a while to develop and I’m still continuing to work on and evolve!
SR: I think another important question to ask is "Who's your audience?" You just came back from visiting Ghana? Can you tell us about that experience? How data lit are they over there?
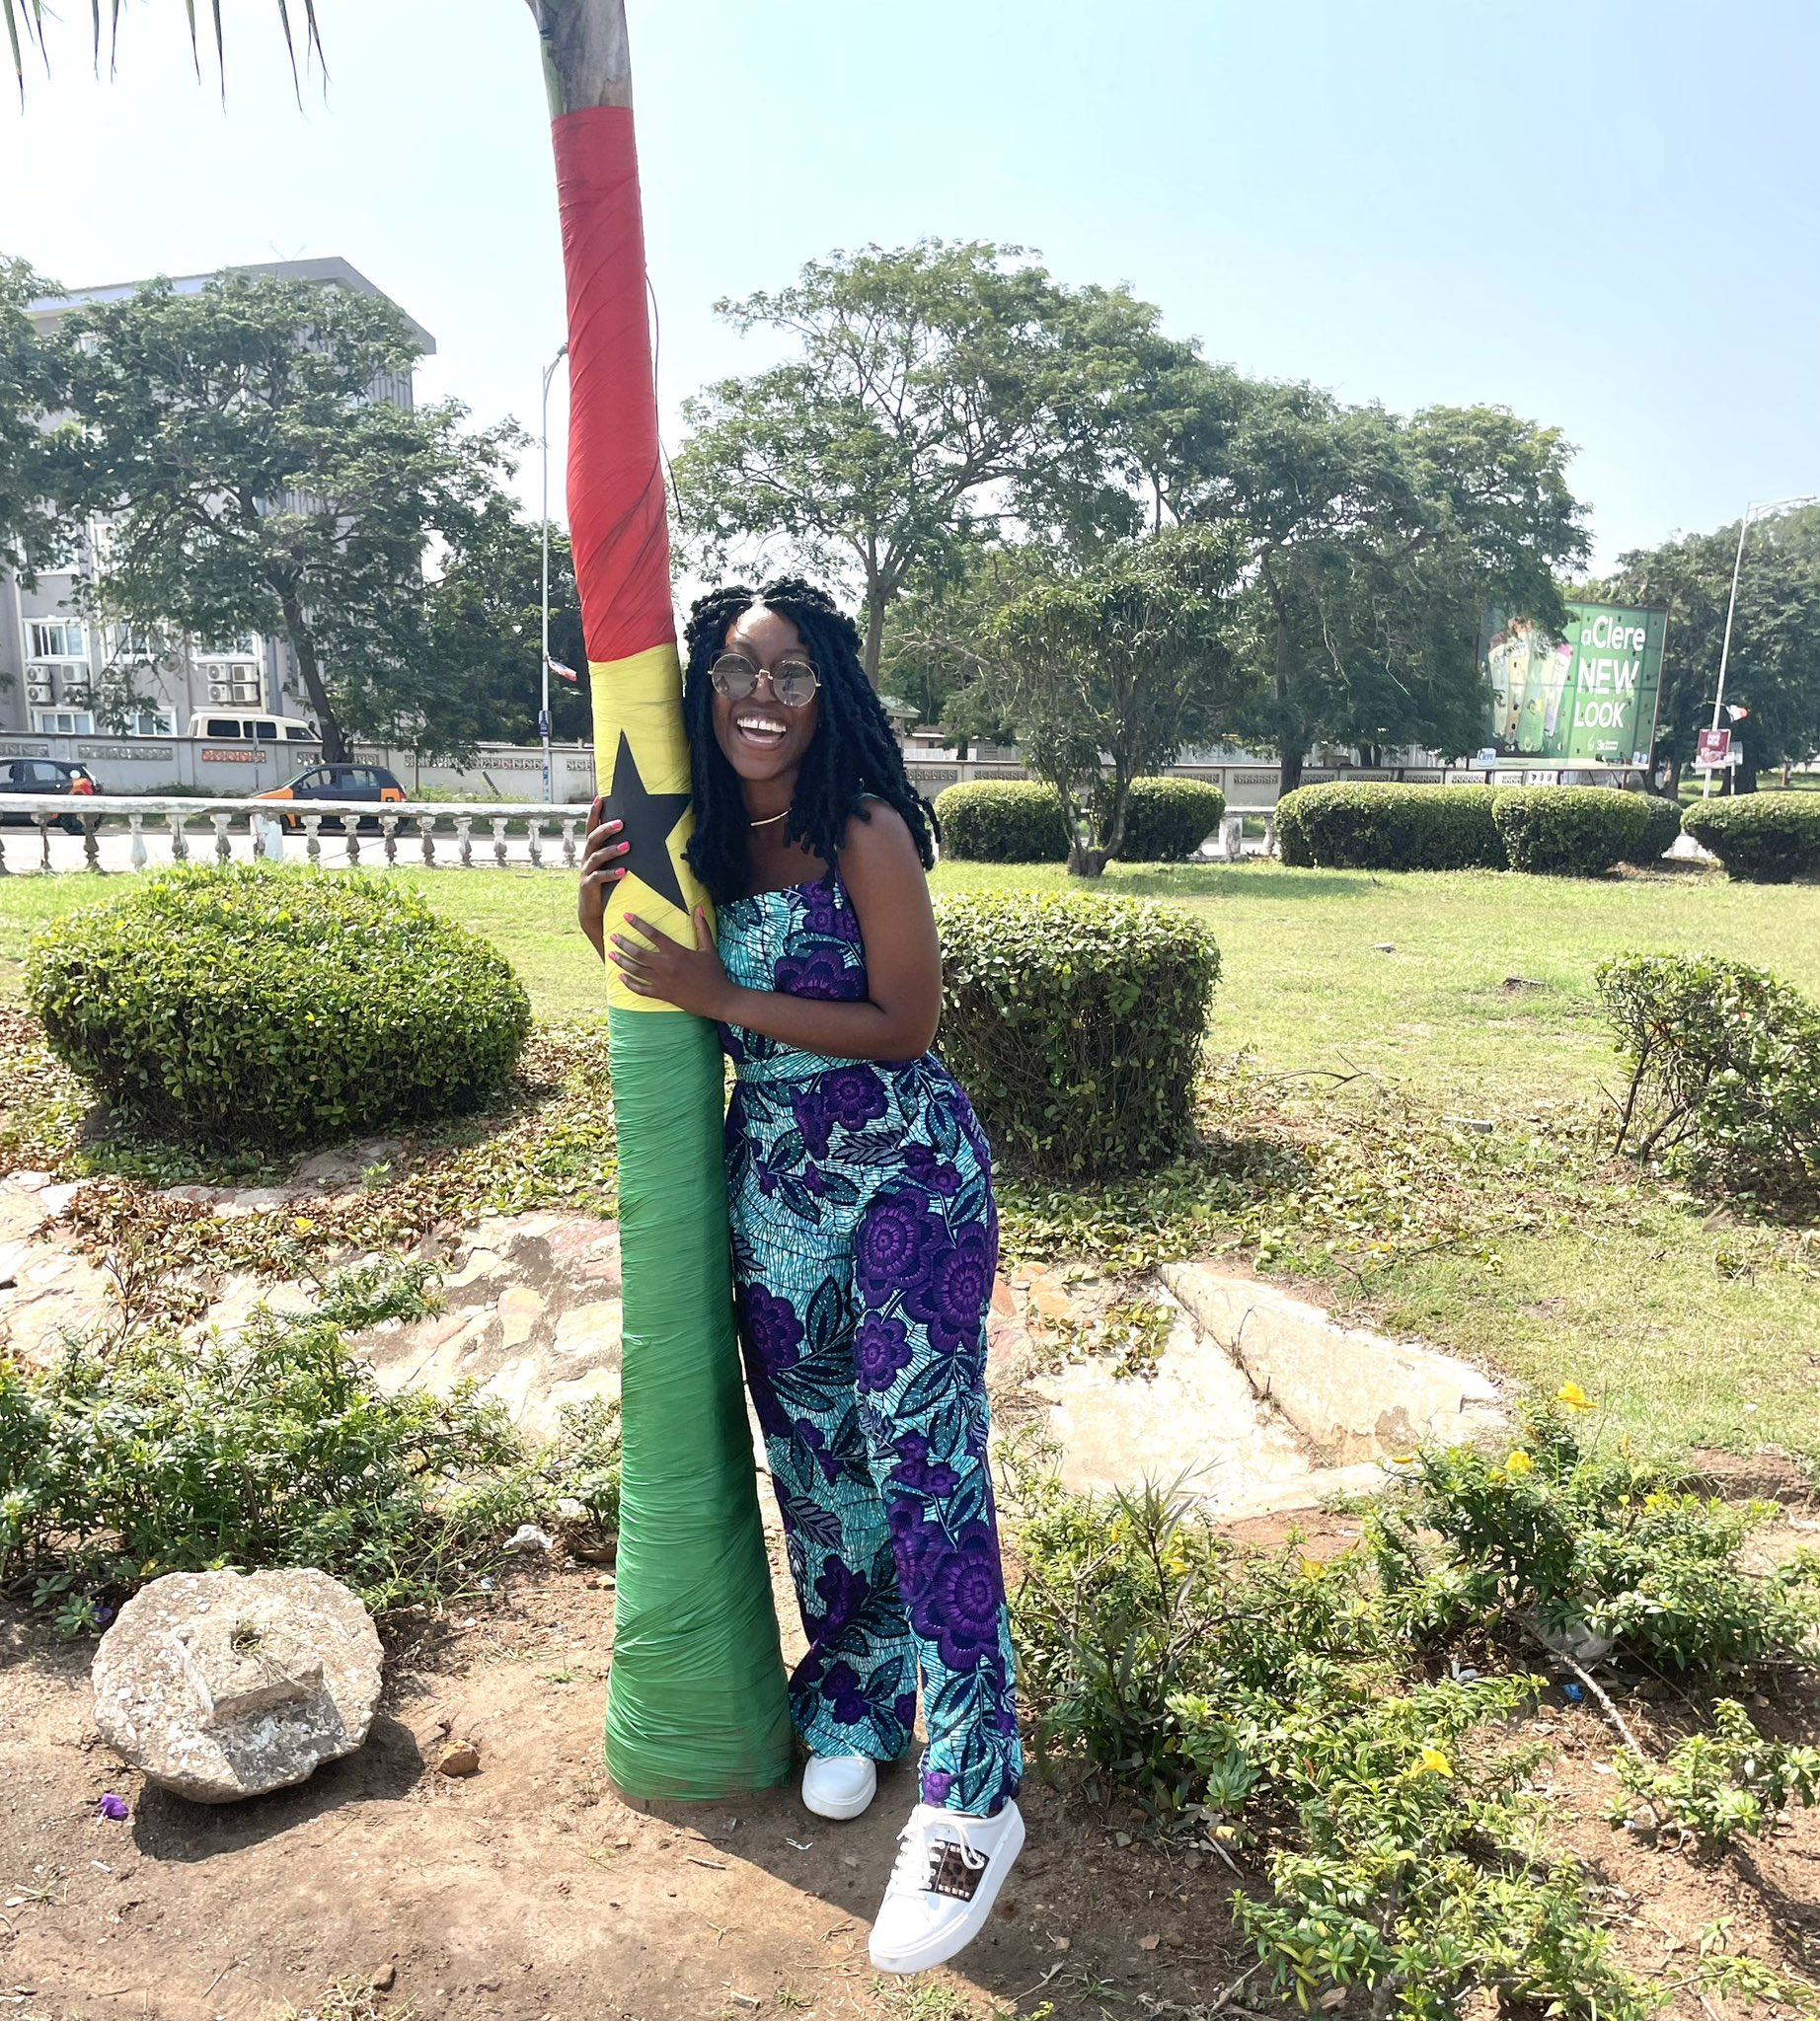
DA: Yes, my family and I went to Ghana for two weeks in August and it was extraordinary! I don’t say this lightly, but I simply had the best food there! It was truly giving five stars on Yelp! One of my favorite dishes are Banku (fermented cassava and corn dough) & Okra soup (which has a thick consistency, similar to gumbo in America). I also tried kenkey for the first time (fermented white corn) with a fabulous pepper sauce and fried fish. My other guilty pleasure was the ice cream there called ‘FanIce’, I probably had on average two a day.

Outside of the food, it was amazing to reconnect with family that I hadn’t seen in so long since the last time I was back in Ghana was 2009. We got the chance to visit Independence Square which is a famous landmark in Accra that was built to commemorate Ghana’s independence from the British. As well as, get some clothes with the traditional ‘kente’ cloth which is a handwoven cloth. Each pattern and cloth have different unique names.
I’d say they’re pretty data lit over there, being as THE Du Bois (W.E.B. Du Bois) became a citizen and spent his last years in Accra. On a side note, I’m also so excited to see more and more of our Datafam members and ambassadors from Africa! Especially excited to see Ghanaian impact and our dear neighbor Nigeria! It’s funny because my family only knew DuBois as an activist and socialist (as did I previously before the #DuBoisChallenge) but I spent way too much time telling them about his impact in the data visualization space! We were also staying pretty close to the home of W.E.B. DuBois at which he lived until his passing. It is now a museum and his burial site that we will have to visit on our next trip.
I am also trying to follow in his footsteps and become a Ghanaian citizen.
AH: What's something you came across in data and life that you would like to explore next?
DA: Data-wise, I’ve typically gravitated more to the front-end aspect but I’m stepping a bit out of my comfort zone and I am excited to start to explore data prep a bit more. I’m starting to learn Alteryx, which I’ve never used but have heard stories of its powerful ability to prepare, blend, and manipulate data quickly. Similar to Tableau, I really appreciate the no/low-code drag and drop ability that Alteryx has as well.
I go through phases a lot in life. Right now, I’m going through a phase where I am really interested in yelp reviews. Whenever my friends and I are going out, I’ll say ‘let me look it up’ on Yelp first. I’ve always been a consumer of reviews and use it as a source of truth. But I recently started writing my own reviews for the places I visit. It’s really nice to actually support small businesses and help other people find my favorite spots! There is a lot of data when it comes to Yelp, so this might evolve into a viz later.
To stay in touch with Dzifa, follow her on Twitter and LinkedIn! You can also check out her Tableau Public profile and read her Yelp Reviews!


