

The Value of Data Questions

Post by: Steve Tadeo, Cover photo by: Photo by Anna Nekrashevich Post Images by: Emma Calvo Balcells

Not all questions are created equal!
“If I had an hour to solve a problem and my life depended on the solution, I would spend the first 55 minutes determining the proper question to ask, for once I know the proper question, I could solve the problem in less than five minutes.” ALbert Einstein
I remember when I first read this Einstein quote. I was in the waiting room for a doctor’s appointment (routine so I’m fine 😊) and a book of Einstein quotes was on the table. The books was titled, "Einstein - The theory of relativity and a book of quotable quotes." Who knew! But Einstein's quote about questions and solutions stayed with me and is very relevant to the topic of data literacy.
Crafting an Insightful Question is Key
There are many dimensions to being Data Literate. Possessing analytics skills, business context, and programming skills are all valuable. Asking the right question, however, may be the most important. I’m feeling on solid ground now being in 100% agreement with Albert Einstein but from that solid ground, I will add a bit to the question solution relationship quote. Not all questions are created equal and the variation in value is linked to the type of analytics question formulated.
Let’s examine how we develop data questions. Do we ask the data questions that are easy to solve? Do we ask the same questions frequently or even always? Do we ask easy, straightforward, comfortable questions? Perhaps the question is that we already know the answer? Are we asking the same question in different ways? We need to ensure that our questions take us to new and different insights.
I want to begin with a review of the analytics spectrum to help us understand question categories from the perspective of the analyst. Let’s explore the connection between the question asked, the analytics required to answer the question and the resulting business value of the solution. The hope is that with a review of the different types of analytics, we can change our questioning patterns and uncover new opportunities and generate greater value.
Analytics Continuum
The analytics continuum illustrated below is a view of analytics from Hindsight to Insight to Foresight. This continuum consists of 5 types of analytics which answer 5 types of questions. The business value of the questions and associated analytics answers increase from left to right on the continuum. Amazon certainly considers sales data and web traffic data as valuable but clearly the business value of predicting or possibly driving future actions is more valuable than the number of customers last month and their sales history.
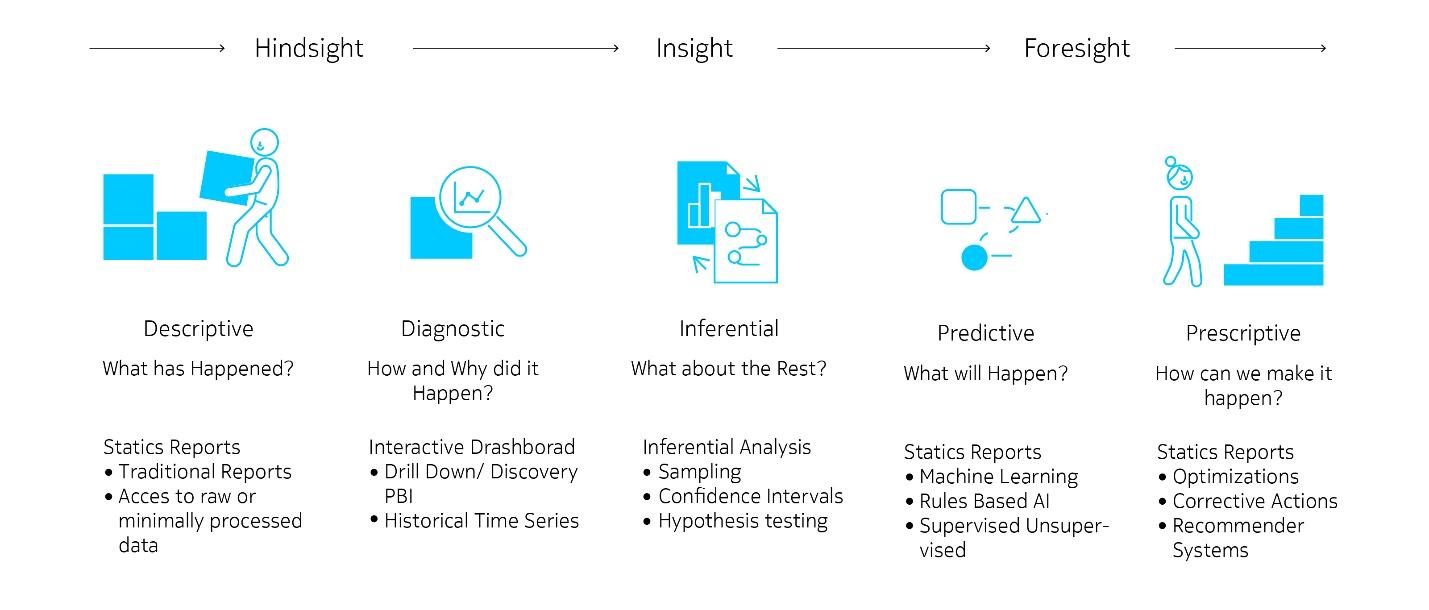
The graphic above identifies each analytics category. The table shows the questions answered and some examples of the analytics for each category. Business value and analytics complexity increase from left to right. In the following sections I will review each category in more detail.
Descriptive Questions
Descriptive analytics answer questions of what has happened. Let’s use a sales scenario to develop a list of questions.
Q1. How many products were sold last month, and what was the average sales price of each product?
Q2. What were the total sales for each day of the month, and what were the averages sales each day, and each week of the month?
Similar questions could apply for different periods such as quarters or years but would still address what happened. These are questions which typically require aggregations and distributions to answer. Descriptive analytics are relatively easy to answer in terms of technical difficulty and create the foundation for more complex data questions.
Examples of “What has happened?" questions.
Descriptive Questions
Data Analysis
What are total sales in Q1?
Sum sales over Q1 period.
What was the average product sale in Q1?
Sum sales of product A over Q1 period
What percentage of the total sales of the company was generated on the Northeast Region? Q1
(Total company sales of Northeast Region / Total company sales) * 100% Q1
The above examples highlight that descriptive questions provide insights into what occurred. The data and processing to answer to these questions are relatively easy to obtain and can be considered foundational questions that set the stage for the other data question types in the continuum.
Descriptive Questions
Diagnostic questions answers how or why something happen. Descriptive questions are the natural lead to diagnostic questions. If for example, product sales from one month to the next increased or decreased; what was the driving factor for the change? Perhaps there were multiple factors and what was the impact of each. Diagnostic questions go beyond knowing what happened and investigate unknown or hidden factors that drove the observed outcomes.
Examples of “How and Why did it happen?" questions.
Diagnostic Questions
Data Analysis
What was the reason(s) for the sales drop in Q2?
Drill down analysis to determine cause. Data before aggregation.
Is sales revenue correlated to marketing spend?
Correlation calculation for scatter plot analysis.
Sales on the 10th of Jan were 25% higher than any other day in Q1? Explain?
Time series analysis and standard deviation analysis.
Inferential Questions
Inferential data analysis is similar to descriptive data analysis in that it is primarily concerned with what happened in the past. Inferential data analysis is different in that it involves not just the data we have, but also the data we don’t have. Sticking with the sales example let’s consider a customer survey. What can the feedback of a portion of your customer base tell you about the larger segment. If 50% of customers surveyed provided positive feedback what does that say about the rest of your customers.
Examples of “What about the rest?" questions
Inferential Questions
Data Analysis
What is my confidence level with the results?
Sample size response rate analysis
What impact will be increasing my sample size by 10%?
Sample size response rate analysis – change in confidence intervals
Is the change in customer response due to an increase due to our new advertisement?
Hypothesis testing
Predictive Questions
Predictive Data Analysis involves using historical data to make predictions about future outcomes. This can be a very impactful but as mentioned earlier as we move up the analytics continuum, the analytics becomes more complex. Predictive questions can be solved with simple trend lines and regression models but can also be much more complex and require machine learning algorithms to solve.
Examples of “What will happen?" questions
Predictive Questions
Data Analysis
What is the likelihood that a sales offer will close?
Machine Learning model to predict outcomes (Sales closure “Yes” or “No”)
What will be the sales for Product “X” in Q2 and Q3?
Regression model to predict sales at points in time.
Customers can be grouped in sales categories. What category is customer “ABC”?
Machine Learning model to organized by cluster and determine customer “ABC” cluster location.
Prescriptive Questions
Prescriptive analytics questions help implement possibilities uncovered in the other questions and solutions in the continuum. There is a natural connection from predictive to prescriptive and typically prescriptive analytics is about implementing actions to enhance the likelihood of predicted outcomes or alter predictions to more desired results.
Businesses can use this form of data analytics to find opportunities for growth and improvement as well as the chance to recognize risks that need to be addressed. Prescriptive analytics are the most difficult and costly to implement but can also have the highest value.
Examples of “How can we make it happen?" questions?
Prescriptive Questions
Data Analysis
What price changes can be made to chance sales likelihood?
Price optimization based on customer profiles.
What is the sequence of events to drive an outcome?
Guided selling modelling where customer and market features detail sales process.
Can a recommender system be utilized to drive sales?
This is a complex modelling based on customer(s) to product(s) characteristics.
Summary
The analytics continuum organizes data questions into 5 categories based on the solutions derived from the questions. Each category creates value, but high business value is achieved as we move across the continuum from left to right. The value of a data question is tied to the value of the associated answer or solution to the question. As we move across the analytics continuum, we encounter more challenging solutions, but the rewards should increase as well.
What is the value of understanding and asking questions across the full analytics spectrum?
- We can develop a more comprehensive view of the business challenge.
- We can change discussions from the historical known to perhaps a less comfortable, but potentially more valuable discussion about discovery and future events.
- We can close the language gap between business domain expertise and data analytics talent.
So next time you encounter a business problem and want a data driven solution, remember that questions drive solutions but not all questions create equal value.