

Sarah Bartlett Reflects on Women in Iron Viz and Representation

Post by Sarah Bartlett. Photo by energepic.com from Pexels
Firstly, I would like to thank Be Data Lit for the opportunity to write this post. Following the 2021 Iron Viz final, I posted a thread on Twitter that summarised my thoughts following Lisa Trescott’s monumental Iron Viz win. Allen Hillery reached out to me after seeing this thread to see if I would like to turn this into a blog post. I hope you enjoy it!
In November 2021, Lisa Trescott became the first woman to win a global Tableau Iron Viz contest since Anya A’Hearn in 2012. For those unfamiliar with Iron Viz, it is the ultimate battle of Tableau skills and the largest data visualization contest of its kind! Three contestants are selected for the Grand Final of the Iron Viz via a visualisation contest (known as a “feeder” or “qualifier”) organised by Tableau Public. Traditionally, there were three feeder contests held per year with one winner selected from each to proceed to the final. However, like many things in 2020, the format was changed slightly. Instead of having three separate feeder contests, Tableau ran a single feeder contest with the top three highest-scoring entries gaining the respective authors a place in the final. This is the same format that was run in 2021.
Lisa Trescott’s win was a monumental moment and one that will no doubt inspire many future contestants. Not only was it a well-deserved win by Lisa and a representation of her talent and hard work, but it was also long-awaited recognition that women can not only reach an Iron Viz final but win the contest. For so many years, there was no female representation in the Iron Viz final at all. To truly appreciate the significance of Lisa’s achievement, and all those that came before her, let’s go back a few years.
Representation in Iron Viz
Back in 2017, the global Iron Viz final was held in the Mandalay Bay in Las Vegas. It was a dazzling affair with plenty of glitz and glam! The show was hosted by Louis Archer, who sported his (now) infamous bedazzled tuxedo, and Jewel Loree who wore a beautiful sequin dress. Together they entertained the packed crowd in the arena while the three finalists, Tristan Guillevin (France), Joshua Milligan (United States) and Jacob Olsufka (United States) wowed us with their vizzes of housing market data, provided by Zillow. Tristan stole the show on the day with his creative use of the pages shelf in Tableau but after the event, many couldn’t help thinking something was missing.
Women.
2017 marked the fourth consecutive year of the global Iron Viz contest which had resulted in an all-male final. The same year we witnessed the inaugural European Iron Viz contest but, you guessed it, the finalists were all male. At the time, Anya A’Hearn was the only woman to have won the global Iron Viz contest back in 2012. The last woman to have reached a global Iron Viz final was the late Kelly Martin in 2013 and until 2017, the Iron Viz finalists had been predominantly white, North Americans, too. In 2017, Tristan was the first global Iron Viz finalist (to my knowledge) to speak English as a second language.
Something Isn't Right
After the 2017 Tableau Conference, many women in the community couldn’t help but wonder why they weren’t being recognised in the Iron Viz contest. Ann Jackson (Tableau Zen Master) published a viz on Tableau Public to celebrate the women who were going the extra mile to enter the feeder contests. Looking back, there weren’t many.
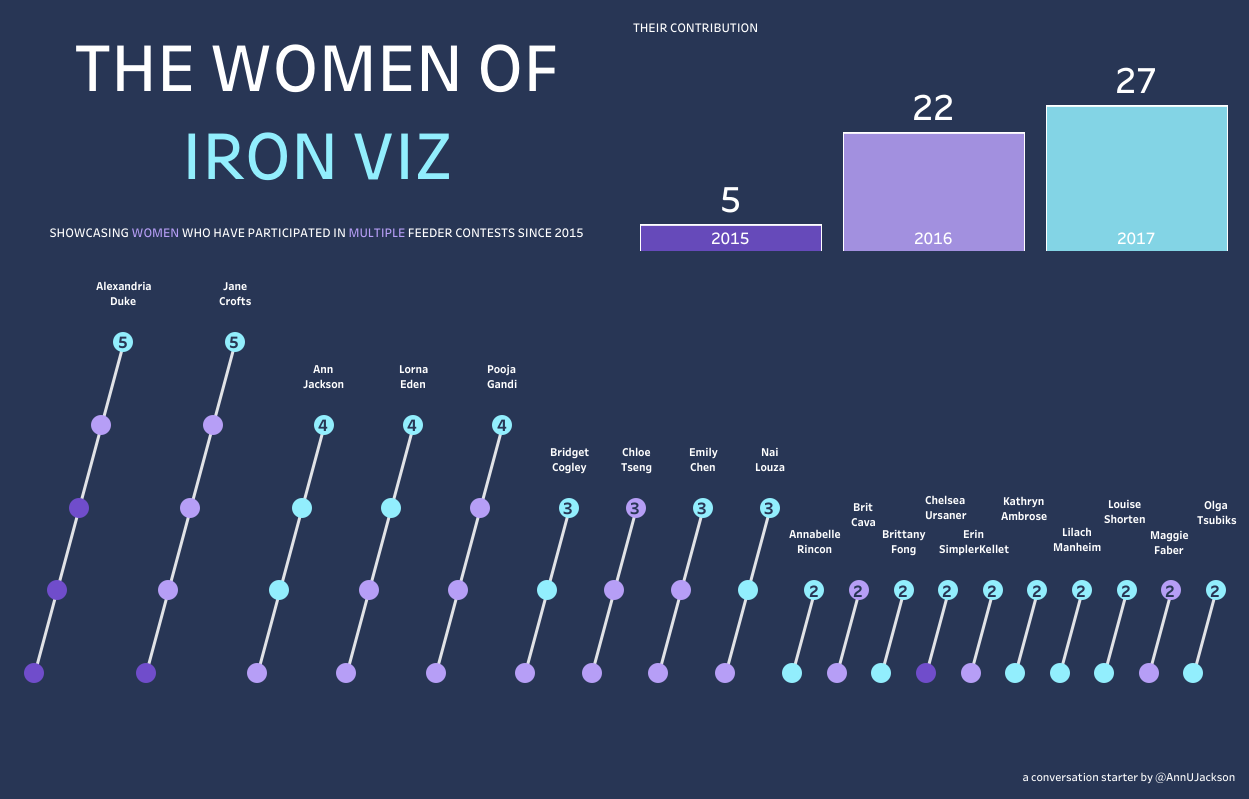
Note: Prior to 2020, the global Iron Viz contest consisted of three feeder rounds with the winner from each round progressing to the final. That meant there were three opportunities to enter the contest each year.
Feeling deflated after witnessing yet another all-male global Iron Viz final, a group of women from the community got together to run a survey, open to everyone in the community, to better understand who was entering Iron Viz and why, but perhaps more importantly, to better understand who wasn’t and their reasoning. The results of the survey confirmed what many had suspected. Would-be participants (regardless of gender) were struggling to enter or be recognised in Iron Viz for several reasons including lack of time (to complete a feeder entry), a lack of interest in the chosen feeder topic, limited skills to source their own data and prepare a compelling visualisation, or worst still, for fear of judgement or not being perceived as ‘good’ enough. These invisible ‘blockers’ were preventing diversity in the contest overall and ultimately, the finals.
My Iron Viz Experience
In early 2018, not long after the community survey results were shared, the second-ever Iron Viz Europe feeder contest was launched. At this point, I had never entered an Iron Viz feeder contest and I very much fell into the group of people who were apprehensive about entering. Regardless, I had some downtime at work and decided to take the plunge and work on my own entry. I recognised that it was a great learning opportunity and it would hopefully be a fun experience. I thought that my chances of reaching the final were incredibly low, so low that I didn’t even consider it a possibility when entering the feeder. To my surprise, my entry landed in third place, thus progressing me to the final! When the finalists were announced, several women from across the community reached out to me to offer me their support. Many were relieved to see a woman represented in the final, a first for Iron Viz Europe and the first in any Iron Viz final since 2013. While this was an enormous honour, it was also a huge weight on my shoulders. After all these years where women had been absent from the contest, I felt like I couldn’t let the women of the community down.
To cut a long story short, I didn’t win Iron Viz Europe that year (congratulations to Klaus Schulte who took the crown that year!). Regardless of the result, I was immensely proud of everything I had accomplished, plus I had a fantastic experience being a finalist in the contest. It was this experience, along with the 2017 survey feedback and general sentiment in the community at the time that inspired me to launch Iron Quest at the end of 2018. Not only did I want to encourage more people to enter Iron Viz and provide a platform where people could practice and refine their Iron Viz skills all year round, but I also wanted more people to have the opportunities and experience that I did as a result. There’s a famous quote by Marian Wright Edelman: “You can’t be what you can’t see.” I firmly believe if we see more people “like us” represented in Iron Viz, we would be more inclined to enter.
"You can't be what you can't see" Marian Wright
Change is Coming
It’s worth noting that since the 2017 survey, and in addition to other feedback given over the years, Tableau have made changes to the Iron Viz contest to make it more inclusive. This has been a key focus area and something that the Tableau team continuously looks to improve and seek feedback on. One significant change a few years ago saw them extend the feeder contest period to 4-weeks, allowing people more time to source their data and produce a worthy viz. They have also offered pre-sourced data sets (instead of asking contestants to source their own data) for some feeder contests. Most recently in 2021, they introduced blind judging, where the identity of the contestants was not revealed to the judges in the feeder round. One challenge that remains is the limited number of countries that the contest is open to. While Tableau adds more countries to the list most years, it continues to be a limited selection. Unfortunately, this is often down to legal restrictions on competitions in many countries and to a large extent, is beyond Tableau’s control.
Despite the changes that have been made to the competition over recent years, representation in the contest hasn’t changed overnight. For instance, in 2018, we witnessed another all-male global Iron Viz final. Things changed for the better in 2019, though. Lindsey Poulter reached the global Iron Viz final, representing the first woman on the global stage since Kelly Martin in 2013. Earlier that year, Anna Dzikowska went on to win the European Iron Viz contest too! Both of these women served as an inspiration to fellow women across the community and helped to encourage participation from under-represented groups. Despite these wins though, we saw an all-male final yet again in the global contest in 2020 (there was no European contest that year). While I’m proud of anyone who reaches the final, it can also be deflating to see others miss out. I served as an Iron Viz judge in 2020 and I can honestly say women appeared to be well-represented in the feeders (unfortunately there is no data to confirm this, this was simply my perception). The feeder contest saw a record-breaking 371 entries that year but unfortunately, only a handful of women were recognised in the top-scoring entries. I often wonder if time and knowledge of complementary tools (such as data preparation and design software) are contributing factors here, but that’s another blog post in itself! I do wish that Tableau collected data on gender from Iron Viz participants, though. Without this data, it’s impossible to say, for sure, if representation is improving or not.
Encouraging Participation
When the Iron Viz feeders launched this year I wanted to encourage participation, particularly from first-time entrants and under-represented groups. Every year I hear from people who are apprehensive about entering Iron Viz for various reasons. Perhaps it’s imposter syndrome, or perhaps they feel like they don’t have the skills or experience needed to win. Regardless of the reason, when the feeder entries start to come through on social media, it can be intimidating, for all of us! I didn’t want this to be a barrier to participation and I was determined to do everything I could to encourage people to enter, even if they felt they didn’t have a “winning” entry.
I don’t run Iron Quest while the Iron Viz feeder is on (this would be counter-intuitive since I want to encourage participants to enter the contest instead), so I decided to do something a bit different this year. I gathered together some friends from the community to provide a feedback network for Iron Viz feeder entrants. Together, we worked with over 20 participants to provide feedback on their “Data + Joy” themed entries and helped them to refine their vizzes and maximise their chances of scoring highly in the contest. One of those participants was Lisa Trescott. Lisa was a first-time Iron Viz entrant and had published an impressive viz on Rupaul's Drag Race Lip Syncs. It was easy to see why this viz scored highly during the judging process. It told a compelling story, backed up with thorough analysis and weaved together with a creative design.


Intimidation and Motivation
Despite running the feedback initiative this year, I saw many tweets on my Twitter feed during the feeder contest from people saying they felt like giving up and not entering the contest. This sentiment was shared by many, irrespective of gender, race, or even Tableau experience. In many cases, these would-be contestants were either intimidated by some of the impressive early entries, or were battling with data or design challenges. The sentiment of these tweets saddened me, bringing back memories of the 2017 survey and the reasons why so many people don’t enter the contest. I knew I had to do something. So, as a final attempt to stop people from giving up and not participating, I started posting motivational GIFs and tweets on Twitter as the deadline approached. Every time I saw a tweet where someone mentioned they were struggling or they were considering not entering, I posted another one. Iron Viz isn’t about winning, after all. I wanted people to have the opportunity to challenge themselves, learn new skills, enjoy the experience and ultimately, be a part of something bigger. A few people, such as CJ Mayes, later mentioned that this gave them the final push that they needed to get their viz completed
As I’ve done for the last few years, I also posted a blog post with a few tips and words of encouragement for anyone doubting themselves or considering not entering the contest. I first published a ‘Reasons to Enter Iron Viz’ post in 2019. A lot has changed since then, both in terms of the Tableau Conference, the Iron Viz feeder process, and my perspective on this topic but ultimately the benefits of entering and reasons to enter remain unchanged. It was this post that Lisa mentioned had encouraged her to enter the contest.
Iron Viz 2021 and Lisa's Win
There were a total of 320 visualizations entered into the 2021 Iron Viz feeder, down from 371 entries in 2020. However, the visualizations were from a broad spectrum of participants, many of whom were entering the contest for the first time. The 320 visualizations were judged by a panel of guest judges from the Tableau community, with the top 10 highest-scoring entries reviewed and scored independently by a second guest judge panel. The three vizzes with the highest scores overall secured their authors a place in the final. The top 10 vizzes can be viewed here. Congratulations to everyone who entered Iron Viz this year and a special mention to Dinushki De Livera and Anne-Sophie Pereira De Sa who were among the 10 highest-scoring entries!
The 2021 global Iron Viz final was always going to be a thrilling watch! The other finalists; Pradeep Kumar G and Samual Parsons were already well-established community members at the time of the feeder contest. Those in the community were familiar with their general viz style and approach. Lisa, however, was a relative newcomer to the community and as such, her work was less familiar to the community. Despite using Tableau at work for several years, Lisa only had a handful of Tableau Public vizzes, her most famous being her Iron Viz feeder entry. Lisa had only recently discovered the Tableau community, too.
The data set chosen for the 2021 global Iron Viz final was provided by Chartmetric. It was global in scope and contained nearly 200 million records spanning several years. It included artist popularity, metadata, YouTube listening data, and loads of Shazam history. The data focused on artist discovery, providing insights on how apps like Shazam (an app that can tell you what song is playing when pointed to a speaker), combined with social media, can help launch the music careers of previously undiscovered talent.
Given the theme, all three contestants focused on music discoveries, but they each took a different approach or scope. Pradeep’s viz analyzed nearly 1,400 top artists from 20 countries to better understand music discovery behaviours across the globe, using the Shazam weekly top charts data. His viz focused on artists’ pronouns to help understand if there were differences in how artists were discovered in different countries, based on their pronouns.
Lisa took a different approach by initially using a logarithmic scale to compare the rank of artists and YouTube channel views over time. From this analysis, Lisa was able to narrow her analysis down to three notable breakthrough artists; Giveon, The Kid Laroi, and Olivia Rodrigo, who stood out for leveraging social media to pull themselves from obscurity. When presenting her viz in the final, Lisa told a compelling story while the interactive elements of her viz really helped to bring the story to life.
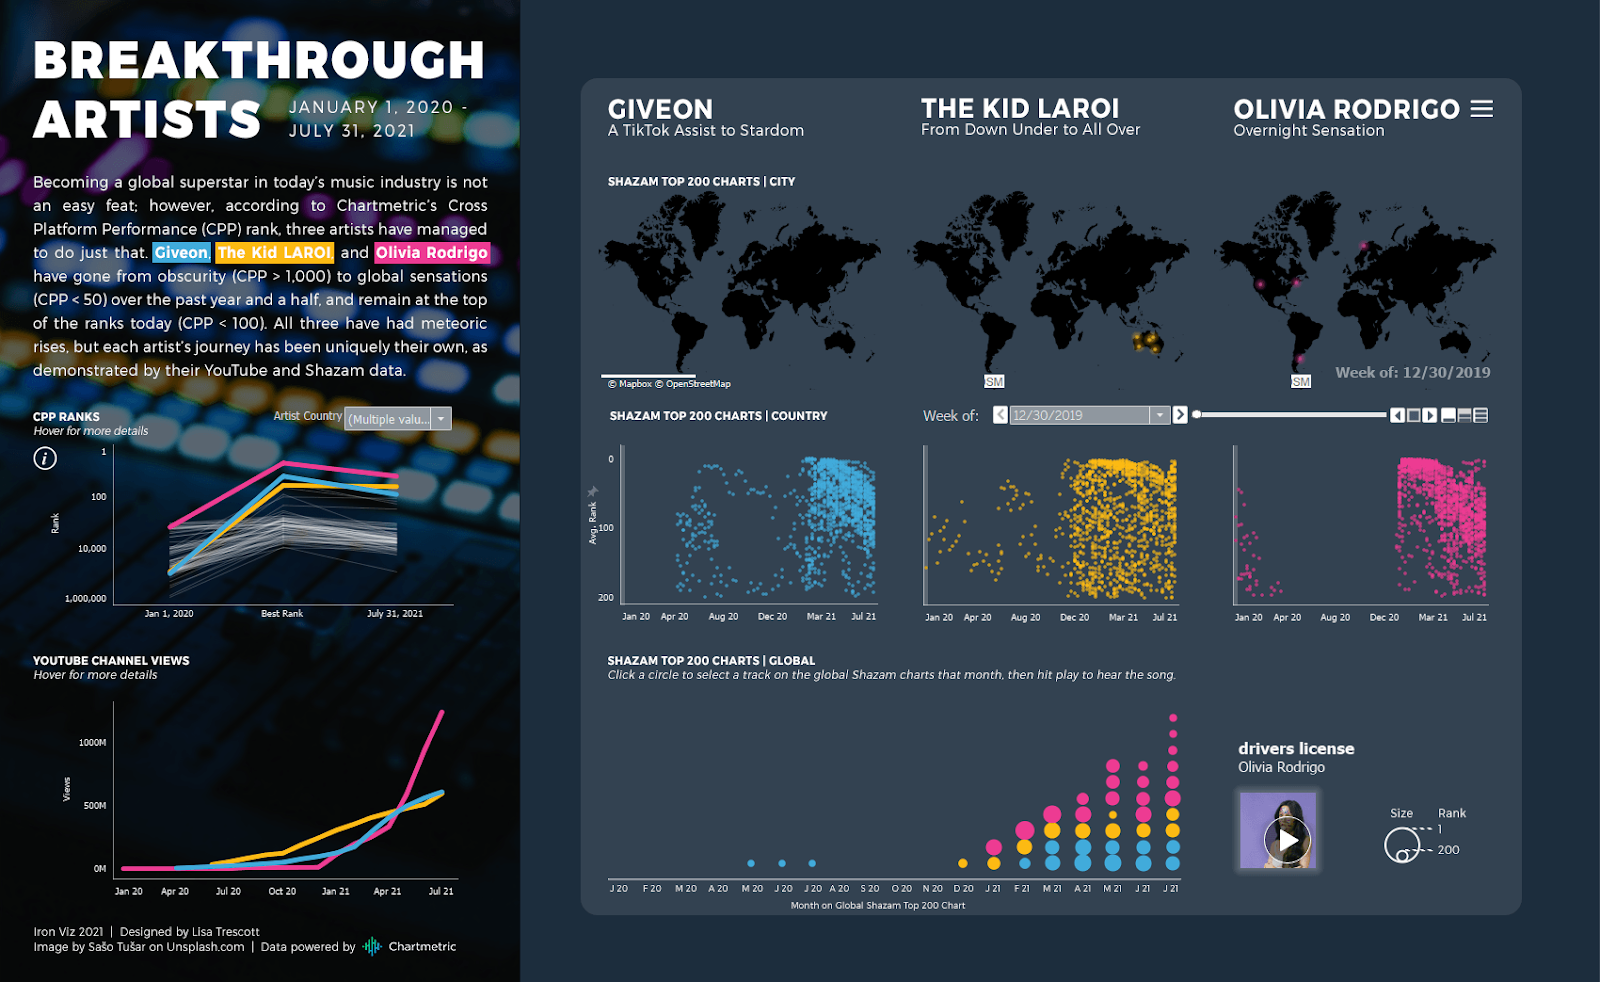
Lisa Trescott's 2021Iron Viz win captivated the audience and displayed a combination of vibrant charts, animation and narrative crafting that was powerful and ultimately, helped her viz to stand out from the rest.
Finally, Samuel took a similar approach to Lisa in his analysis by focusing on how new artists are establishing themselves in the Chartmetric top 100 rankings and how technology directly impacts their fortunes. Samual showcased an impressive use of collapsible show/hide containers to enable him to slowly reveal a guided story on his viz. His data story demonstrated the power TikTok has over the music industry and followed a song’s path from a TikTok post to becoming a viral sensation.
While all three contestants did incredibly well, Lisa’s eye-catching viz and impressive presentation skills captivated the audience. People were drawn into her story on the breakthrough artists and their unconventional rise to fame. The judges agreed that her combination of vibrant charts, animation and narrative crafting was powerful and ultimately, helped her viz to stand out from the rest.
When Lisa was announced as the winner, I couldn’t have been happier! After all of these years, it was recognition that a woman CAN win Iron Viz. For the majority of the community, this would have been their first time witnessing a woman take the Iron Viz crown; myself included since Anya’s win in 2012 happened before I started using Tableau. It was an emotional moment and one that I hope paves the way for more women and under-represented groups in future. It’s also validation that all of the work that has been done over the years to help improve representation in the competition, and the community at large, is working. Congratulations, Lisa! I couldn’t be more proud of you.
If you are considering entering Iron Viz next year, check out my blog post for Tableau Public which describes what you can do to help prepare yourself for the competition.
Thank you for reading.
Not only did I want to encourage more people to enter Iron Viz and provide a platform where people could practice and refine their Iron Viz skills all year round, but I also wanted more people to have the opportunities and experience that I did as a result Sarah Bartlett on Starting Her Iron Quest Initiative

Sarah Bartlett is a 2 x Tableau Zen Master, Tableau Public Ambassador and Tableau Enablement Consultant at Red Hat. By day, Sarah supports the internal Tableau Community at Red Hat by helping them to overcome their data challenges and visualise their data more effectively in Tableau. Sarah holds three certifications in Tableau Desktop and is passionate about helping others on their Tableau Certification journey. In 2019, Sarah launched #IronQuest; a monthly community data visualisation initiative designed to prepare individuals for the Iron Viz feeder contests. Sarah blogs about her Tableau experiences at www.sarahlovesdata.co.uk. Follow her on Twitter and LinkedIn.

Lisa Trescott won the 2021 Iron Viz competition with dazzling and concise visuals and awesome storytelling! She's a research analyst at MiraCosta College who supports the college's student equity and achievement programs. She recently chatted with us about her Iron Viz Win. Catch that here!